Start with the number every trade outlet ran in the first days of August: the global secondary watch market did $10.5 billion in transactions in the first half of 2026, up 37.2% on the same period a year earlier. The figure came from EveryWatch, a data platform that says it draws on 650 dealers and 472 auction houses. Within days it had been reported by JCK, syndicated as a nine-page research note by an investment newsletter, and folded into the next round of “the market is booming” copy across the trade.
Nobody asked the obvious question, which is the one this masthead exists to ask: $10.5 billion of what, exactly, and how much of it can anyone outside the platform actually check?
The answer is one number, and it is smaller than the headline by two orders of magnitude. $680 million of that $10.5 billion — 6.5% — is auction sales, where a named house publishes a hammer price in public. The rest is 650 dealers telling a platform what they sold something for, and the platform telling everyone else.
That is not an accusation of fraud. It is the plain reading of the sourcing every one of these platforms discloses about itself, once you go and read it rather than the chart it produces. We have used one of them ourselves, twice — WatchCharts, for the Daytona’s 51% correction and again in our piece on the waiting-list era — as though the number on the page were simply what the market did. This is what is actually behind it, on the platforms’ own words, and what survives the checking.
What “sold” is allowed to mean
WatchCharts is the index most cited in this trade, including by this masthead. Its live methodology pages return a Cloudflare interstitial to an automated request — confirmed 24 August 2026, both by direct fetch and by this tool’s own browser-based fetcher — so what follows is drawn from the last version the Internet Archive has, crawled 24 April 2024. The company has had eighteen months to change its method; nothing found elsewhere in reporting on WatchCharts since suggests it has, and the description matches what trade coverage still says about it in 2026.
Here is WatchCharts, in its own words, on how a “market price” gets made:
“We use a weighted 30-day window of transactions to calculate the market price for a given day. We use the transaction price if it is known, or the last asking price otherwise. In cases where an insufficient number of transactions exist, we may also supplement the data with prices of unsold listings.”
Read that last sentence again. A number that looks like a sale can be a listing that never sold at all. The company is not hiding this — it is stated plainly, under a heading called “Methodology,” on a page called “About.” It also names the problem in its own “Limitations” section: “Often times, the final selling price of a listing is not made publicly available. When this is the case, we use the last known price before the listing is sold for our analysis” — which is a precise way of saying the asking price stands in for the sale whenever the sale itself is unknown, which for most listings it is.
WatchCharts is also honest about where this bites hardest: “The watch market is top heavy… There are many obscure watches for which we may only have a handful of data points.” For a steel Daytona, turning over constantly across thousands of listings, the 30-day window is thick with real transactions and the asking-price substitution barely matters. For an obscure reference — which is most references — “market price” can mean one or two asking prices, dressed in the same decimal precision as everything else on the chart.
The one platform that says it doesn’t do this
Chrono24 built ChronoPulse, launched in October 2023, as an explicit answer to exactly this problem. Its CEO, Tim Stracke, put the contrast in words when the index launched: “asking prices are no longer the final truth. We see a lot of prices being negotiated down.” Chrono24 is not just a data vendor here — it is the marketplace itself, so a transaction going through its own checkout is closer to a genuinely witnessed sale than anything WatchCharts scrapes from a third-party listing.
The index’s own methodology note, published with its March 2026 update, states it plainly: “The ChronoPulse Index tracks price developments across 14 major luxury watch brands and 140+ model references, based on real transaction data on Chrono24’s global marketplace.” That is a stronger claim than WatchCharts makes about itself, and there is a structural reason to believe it: Chrono24 can see its own completed sales, not just what a seller posted and later took down.
It comes with its own, smaller print. 140 model references across 14 brands is a narrow basket — the index tells you nothing about a Cartier Tank Louis, a vintage Universal Genève, or the several thousand other references that trade daily and simply are not in it. And the note adds, without further comment: “Regional breakdowns are not yet available.” A single global EUR figure can rise because the US market cooled while Asia ran hot, or the reverse, and nothing in the number tells you which.
The $10.5 billion, and the $680 million inside it
EveryWatch is the platform behind this month’s headline figure, and it makes the strongest claim of the three. Co-founder Giovanni Prigigallo, in an interview with trade title Europa Star: “All the statistics are based on actual sales data, i.e. the price that someone actually paid. And we rely on ‘median’ effects to correct for potential exceptions.” Verification, by his account, is “a mix of artificial intelligence and manual processing” with “built-in control procedures.”
What that description does not include is any way for a reader — or, as far as could be established, anyone outside EveryWatch — to see the underlying sale a given figure rests on. The company aggregates listings and results from marketplaces, dealers and auction houses, tags certain ones as sold, and publishes the total. A dealer marking its own listing “sold” at a given price is not a lie detector test. It is a claim, made by a party with every incentive to look busy, entered into a system that has no independent way to check it against what actually changed hands.
Except for one part of it. EveryWatch’s own H1 2026 report — $10.5 billion in total sold value, 795,000 watches, drawn from 650 dealers and 472 auction houses — breaks out auction sales separately: $680 million, up 45% on the year before.
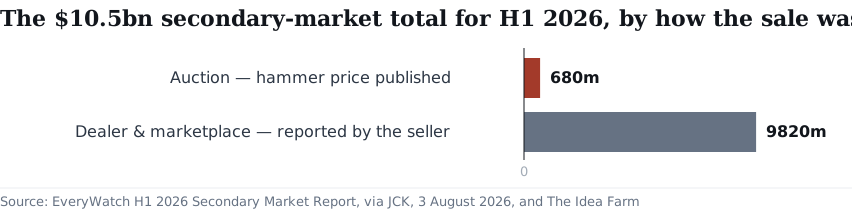
That is the whole of the report’s checkable core. An auction hammer price is called out loud in a room, published by name against a lot number, and — unlike a dealer’s “sold” tag — the buyer’s premium on top of it is disclosed as a matter of house policy, not platform courtesy. Everything else in the $10.5 billion — the $9.82 billion of it that is 93.5% of the total — is dealers and marketplaces reporting their own results to a platform that then reports the aggregate back to the trade as fact. Direct requests to everywatch.com’s own analytics and report pages returned “You have been blocked” (blockCode 582) on the day this was checked, so even the company’s own presentation of that split could not be read past what trade coverage has already relayed of it — noted here rather than glossed over, per this masthead’s rule on saying so when a source refuses you.
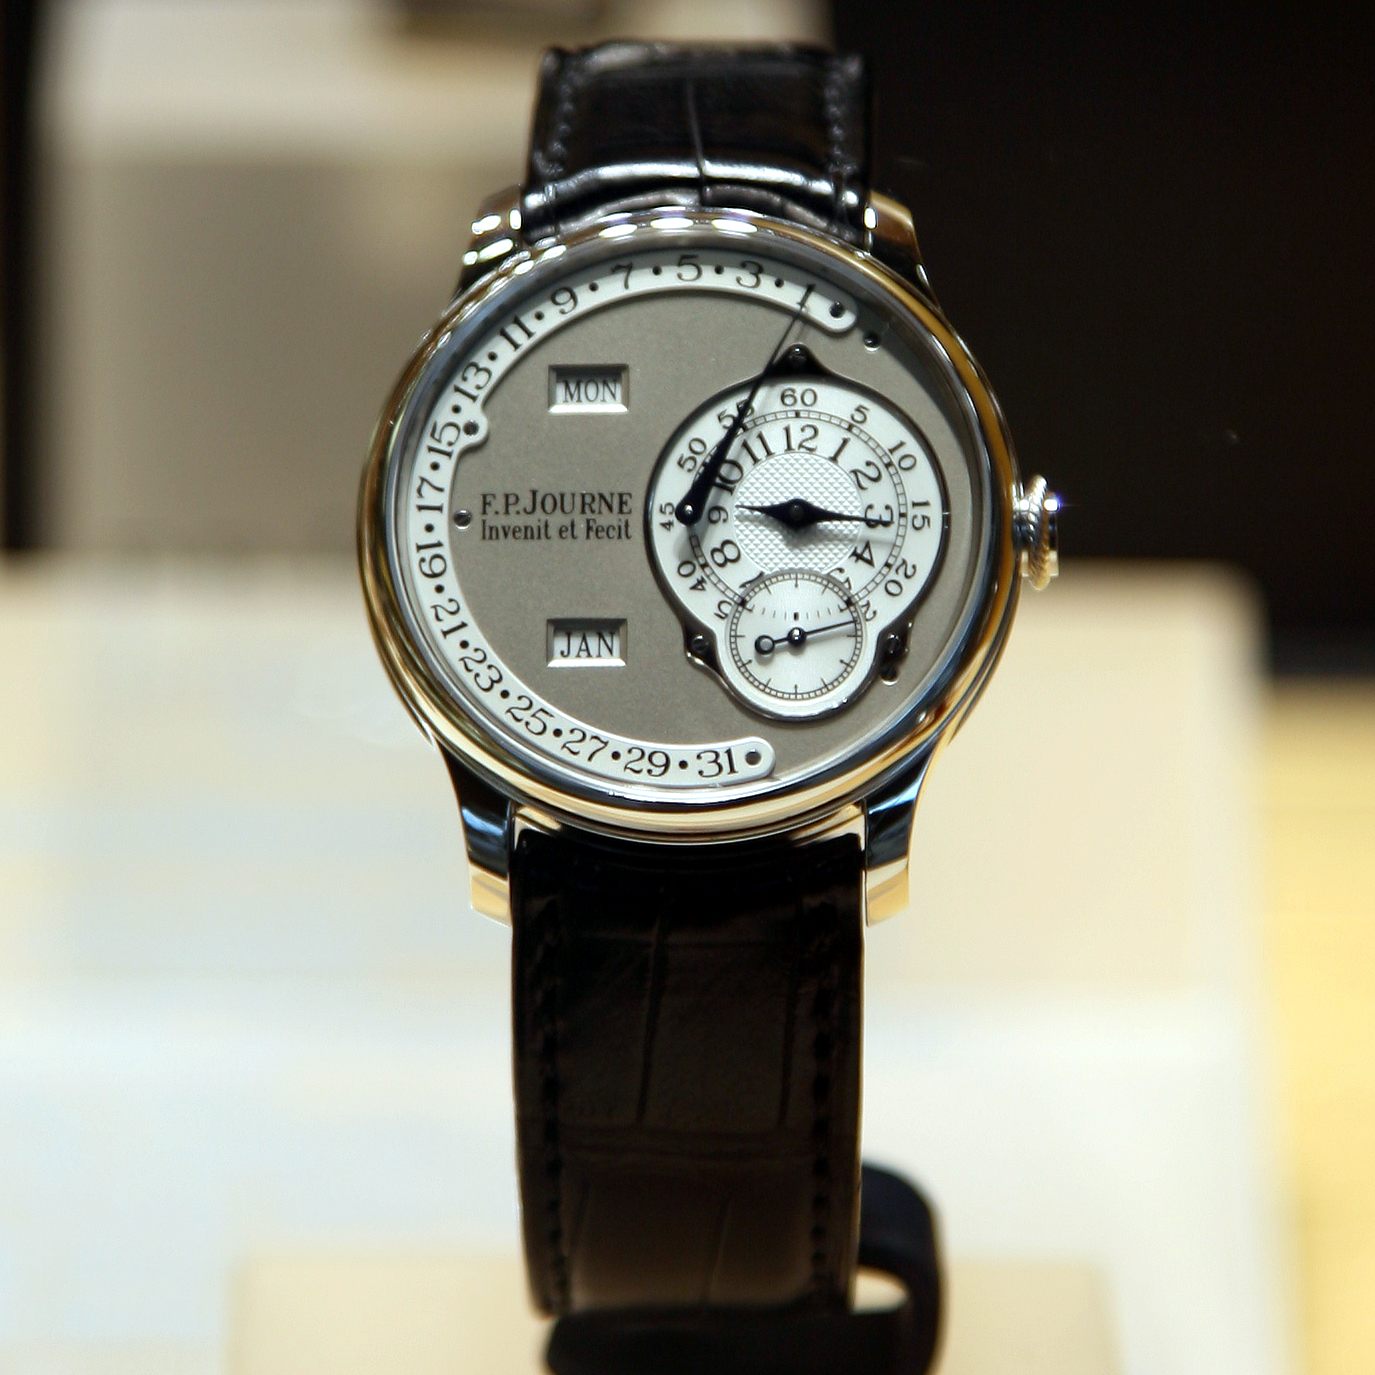
The same report’s most striking single-brand number is F.P. Journe: 608 watches sold in H1 2026 for $201.6 million, a median price of $215,000, up 82% on the year — entirely dealer- and marketplace-reported, no auctions broken out separately for it. It is a useful figure to hold in mind for the next section, because it is about to meet the one part of this market where Journe’s performance can actually be checked against a public record.
The part with a receipt says something more complicated
Auction results are not just smaller than the rest of the market — they are also the one place a critical reader can check the platforms’ story against a public record, and when you do, the story gets more interesting than “the market is booming.”
Tony Traina, who runs the auction-focused newsletter Unpolished, built a method for exactly this: comparing each lot’s hammer price against the auction house’s own pre-sale high estimate, aggregated across a season. He is honest about the limits of his own instrument before using it: “Watch auctions are far from perfect as market indicators. Bids can be performances as much as true valuations.” That caveat matters, and it is worth taking as seriously as the one this piece makes about the platforms above — an auction estimate is itself somebody’s opinion, offered by a house with an incentive to lowball it, so a “beat” is not a pure read of demand either.
With that stated, his numbers for the November 2025 Geneva season — Christie’s, Phillips and Sotheby’s combined — are the most textured public data in this entire market, and they come with their own sample-size warning attached: Traina’s lot-by-lot count found Patek Philippe, Rolex and Audemars Piguet together accounted for more than 60% of the total lots on offer, per SJX’s relay of the figures. The “checkable” part of this market is not a random sample of it — it is whichever three brands the salerooms choose to consign, which is its own kind of selection the aggregate platforms don’t have to declare. Results hammered at 99% of high estimate in aggregate, against 86% a year earlier: a strong season, headline-consistent with the “recovery” story every platform is now telling. But the brand breakdown, relayed by trade site SJX, is not evenly strong. F.P. Journe hammered at 176% of high estimate, up from an already remarkable 146% in 2024. Rolex and Audemars Piguet — between them a large share of EveryWatch’s reported dollar total — did not crack 80% of their own average high estimate, down from 88% and 85% respectively the year before.
That is not a contradiction of EveryWatch’s report, which measures dollar volume rather than performance against expectation, and Rolex can dominate total secondary value while still undershooting what the salerooms expected of it. But it is a texture the $10.5 billion figure cannot show, because the figure is an aggregate and the auction data is not. The one part of this market you can actually check turns out to disagree, in an interesting and specific way, with the “everything is up” gloss the rest of the number invites — and the fact that it can disagree at all is the whole argument for checking it.
The part that cuts the other way
None of this means the platforms are making the numbers up, and it would be a cheap, sweeping thing to write if it did — precisely the kind of claim this masthead’s own standards rule out. Three separate operations, built on different scraping methods and different incentives, are broadly telling the same directional story this year: a correction that bottomed out in 2025, a recovery running through 2026, independents growing faster than the majors, Rolex normalizing rather than collapsing. Three flawed, differently-flawed instruments landing on the same direction is a weaker signal than one clean one, but it is not nothing — it is closer to three witnesses who disagree on the details but not on what happened.
And the asking-versus-transaction problem is smallest exactly where the most money moves through it. A steel Daytona or a Royal Oak in the popular references trades constantly enough that WatchCharts’ 30-day window is genuinely thick with real transactions — the substitution clause in its methodology mostly reaches for obscure references precisely because they are the ones without enough sales to need anything else. The instrument is most trustworthy where most readers actually use it, and least trustworthy on the rare independent pieces where — as this section has just shown — the dollar swings are largest and the auction record is thinnest per brand. That is a genuine complication, not a get-out for the rest of this piece: it means the aggregate $10.5 billion figure, weighted toward exactly the low-liquidity, high-value end of the market where verification is hardest, deserves more scepticism than a Daytona chart does, not less.
How to read a watch price chart
Three habits, and they take longer to describe than to do.
Ask what the window is, and whether it says so. A 30-day rolling window — the industry default — means every “up 5% this month” figure is really comparing two overlapping 30-day averages, not two clean snapshots. A single large sale near the edge of the window can move the whole line.
Ask whether the platform tells you transaction from listing. WatchCharts does, in its own methodology, once you find the page. Chrono24 claims not to need to. Most retellings of either — including trade coverage, including our own past pieces — do not carry the distinction forward. If a chart doesn’t say which it’s measuring, assume it is blending both.
Weight the reference by its liquidity, not its price. The steel sports watches that dominate secondary-market headlines are also the ones with genuine transaction density behind their numbers. An obscure independent reference at $200,000 carries the same decimal-point authority on the same chart, built from a fraction of the data.
And where a public auction result exists near the date you care about, read it before the aggregate. It is the only number in this entire market that was said out loud, in a room, on the record.
Verdict: the $10.5 billion figure is not fabricated, and the platforms behind it are not hiding their methods — WatchCharts states its substitution rule in writing, Chrono24 states what it claims to avoid, EveryWatch states that its numbers are actual sales without stating how a claimed sale is confirmed as one. But only 6.5% of this market’s most-quoted number this year was independently checkable by anyone outside the businesses reporting it, and the part that was checkable told a more complicated story than the headline did. Treat every other figure in this trade, including the ones this masthead has printed, the same way: as an aggregate opinion from an interested party, dressed as a measurement, until the underlying sale is something a reader could actually go and look at.